
Trend Reversals are market scenarios wherein the market reverses against a prior opposing trend. It could be a bearish reversal developing after an uptrend market or a bullish reversal developing after a downtrend market.
Trend Reversals can be excellent trading opportunities because it allow traders to maximize their profits if they can open their trades near the beginning of the trend and close their trades at the end of the trend.
The trading strategy we are about to discuss is an example of how we can use the confluences between two trend-following technical indicators to identify potential trend reversals and profit from the market.
Zero Lag MACD
The Zero Lag MACD Indicator is an oscillator type of technical indicator that was developed to help traders identify the direction of the market’s momentum and visually observe and identify possible oversold and overbought markets that may result in a market reversal.
As its name suggests, the Zero Lag MACD Indicator is based on the MACD or the Moving Average Convergence and Divergence indicator. It is very similar to the classic MACD oscillator but with a slight difference. Unlike the classic MACD, which tends to be lagging when compared to price action, the Zero Lag MACD produces momentum indications and market reversal signals with significantly less lag.
The Zero Lag MACD calculates for the difference between two Exponential Moving Average (EMA) values. These underlying EMA lines are typically preset as 12-period and 26-period EMA lines. However, traders may also modify these variables for it to fit their trading strategy. It then uses the difference between the two underlying EMA lines as a basis for plotting its MACD histogram bars.
The next value it calculates for is its Signal Line. The Zero Lag MACD calculates the Exponential Moving Average of its MACD histogram bars and uses the resulting values to plot its Signal Line.
The MACD histogram bars and its Signal Line can be used together to objectively identify potential momentum reversals based on the crossing over of the two. Crossovers, wherein the MACD histogram bars would cross above the Signal Line, indicate a bullish momentum reversal. On the other hand, crossovers, wherein the MACD histogram bars would cross below the Signal Line, indicate a bearish momentum reversal.
In addition to this, bullish crossovers that occur while the MACD histogram is extremely negative may be a high probability bullish mean reversal signal, while bearish crossovers that develop while the MACD is extremely positive indicate a high probability bearish mean reversal.

Percentage Crossover Indicator
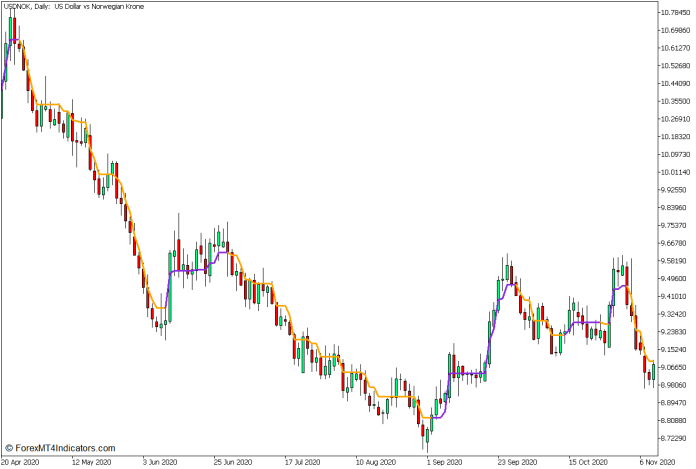
The Percentage Crossover Indicator is a trend-following technical indicator that is used to help traders identify the direction of the market’s momentum based on the Daily time frame.
This technical indicator plots a line that follows the movements of price action based on a complex algorithm. This line shifts up whenever price action is in a bullish market momentum and shifts down whenever price action is in bearish momentum.
The line that the Percentage Crossover Indicator plots also change color whenever its slope shifts. It plots a blue-violet line whenever its line starts to slope up. Inversely, it also plots an orange line whenever its line starts to slope down.
This changing of the color of its line indicates a momentum reversal which traders may use as a momentum reversal entry signal in confluence with other momentum reversal signals and indications.
Trading Strategy Concept
This trend reversal trading strategy trades on a confluence of confirmed trend reversal signals coming from two highly reliable technical indicators, the Zero Lag MACD, and the Percentage Crossover indicator.
It is important to note that this strategy works only on the Daily Timeframe as the Percentage Crossover Indicator is optimized for the Daily Timeframe.
The Percentage Crossover Indicator is used as one of the momentum reversal signal indicators. This is identified by a strong momentum candle crossing over its line followed by the shifting of the slope of its line and a changing of the color of its line within a few bars. This indicates a possible trend reversal right after a strong momentum moving against a prior trend.
The Zero Lag MACD is then used to confirm the possible trend reversal. This is based on the shifting of its bar from positive to negative or vice versa depending on the direction of the possible trend reversal.
These trend reversal signals should be in confluence with one another and should develop within a few candles from each other. If possible, these signals should be aligned indicating a strong confluence between the trend reversal signals.
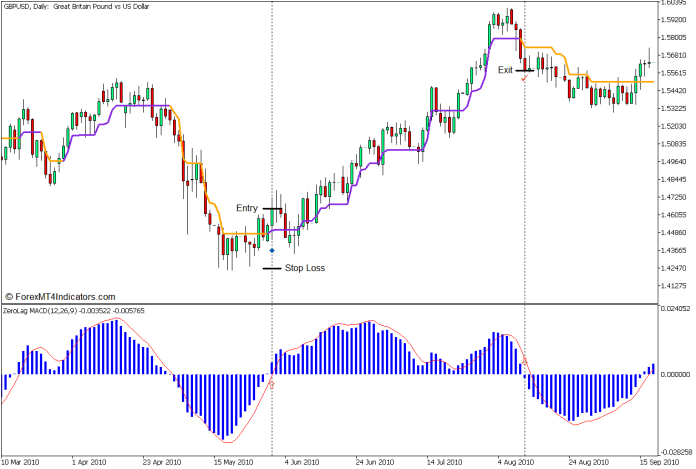
Buy Trade Setup
Entry
- Coming from a downtrend market, a strong bullish momentum candle should close above the Percentage Crossover line.
- The Percentage Crossover line should start to slope up and change to the color blue-violet.
- The Zero Lag MACD histogram bars should cross above zero.
- Open a buy order on the confluence of these bullish trend reversal signals.
Stop Loss
- Set the stop loss on the fractal below the entry candle.
Exit
- Close the trade if the Percentage Crossover line slopes down and changes to orange.
- Close the trade if the Zero Lag MACD histogram bar shifts below zero.
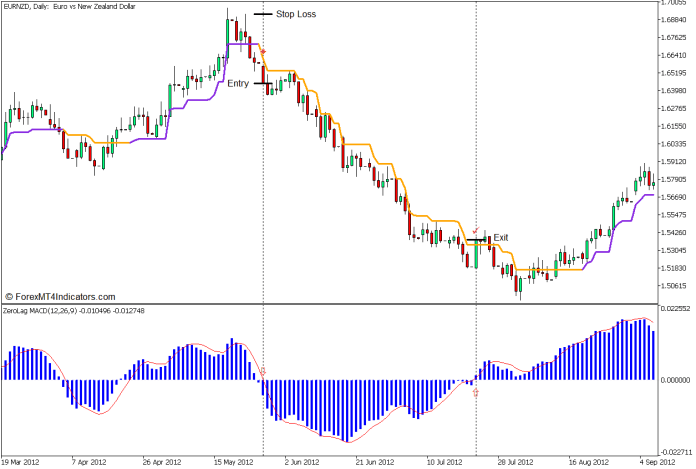
Sell Trade Setup
Entry
- Coming from an uptrend market, a strong bearish momentum candle should close below the Percentage Crossover line.
- The Percentage Crossover line should start to slope down and change to the color orange.
- The Zero Lag MACD histogram bars should cross below zero.
- Open a sell order on the confluence of these bearish trend reversal signals.
Stop Loss
- Set the stop loss on the fractal above the entry candle.
Exit
- Close the trade if the Percentage Crossover line slopes up and changes to blue-violet.
- Close the trade if the Zero Lag MACD histogram bar shifts above zero.
Conclusion
This trading strategy can be very effective if used correctly. This means traders should use it in the right market context, a trend reversal signal developing right after a prior opposing trend or momentum. Traders should also be disciplined when using this strategy as its signals should only be traded whenever the signals are in confluence and are closely aligned.
Although this trading strategy is very effective, the signals that it produces can be very few because it is based on the daily timeframe. Traders need patience and discipline to implement this trading strategy correctly.
Forex Trading Strategies Installation Instructions
This MT5 Strategy is a combination of Metatrader 5 (MT5) indicator(s) and template.
The essence of this forex strategy is to transform the accumulated history data and trading signals.
This MT5 strategy provides an opportunity to detect various peculiarities and patterns in price dynamics which are invisible to the naked eye.
Based on this information, traders can assume further price movement and adjust this strategy accordingly.
Recommended Forex MetaTrader 5 Trading Platforms
XM Market
- Free $50 To Start Trading Instantly! (Withdrawable Profit)
- Deposit Bonus up to $5,000
- Unlimited Loyalty Program
- Award Winning Forex Broker
- Additional Exclusive Bonuses Throughout The Year

>> Claim Your $50 Bonus Here <<
How to install This MT5 Strategy?
- Download the Zip file below
- *Copy mq5 and ex5 files to your Metatrader Directory / experts / indicators /
- Copy tpl file (Template) to your Metatrader Directory / templates /
- Start or restart your Metatrader Client
- Select Chart and Timeframe where you want to test your forex strategy
- Right click on your trading chart and hover on “Template”
- Move right to select the MT5 strategy
- You will see strategy setup is available on your Chart
*Note: Not all forex strategies come with mq5/ex5 files. Some templates are already integrated with the MT5 Indicators from the MetaTrader Platform.
Click here below to download:
Get Download Access