
We all know how much we pay on mortgage interest. Also, we all know how little money banks and other financial institutions make from so-called “high interest savings accounts” to be honest. But do you know what you can earn if you invest your hard earned money properly?
Have you ever asked yourself any of the following questions?
- What is the average return on investment in Canada?
- Is a 3% return on investment good?
- Is a 5% return a good investment?
- Is a 10% return on investment realistic?
The financial industry tries to give you answers, but usually they are trying to sell you products like conflicts of interest.
I spent years learning to be a better investor, navigating all the proverbs and relying on what I learned the hard way.
What is the average return on investment in Canada?
You should start with benchmarks. Today in Canada, the benchmark is the TSX where primary stocks are traded.
Interestingly, there are currently no ETF products that track the full TSX. The closest I’ve found is based on the S&P Global Index and covers most stocks. “S&P/TSX Capped Composite”.
For Canadians looking for a base benchmark to start with, it’s the one. From a total return perspective, what you can expect is a passive investment approach using this broad Canadian index ETF with returns of around 7%.
Currently, the average return on investment in Canada is around 7%.
– iShares Core S&P/TSX Capped Composite Index ETF
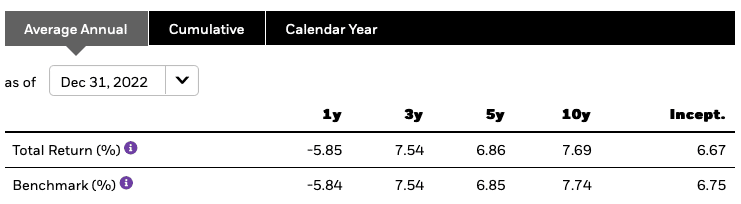
This is the baseline we will use from now on. Even if the index shows constant growth, what matters is the product you can actually buy that comes closest to the benchmark.
Pay attention to: Most DYI investors do not know the performance of their investments. They refer to the broker’s information and only show percentages like 75% or 236% which includes the profit/loss percentage, but nothing really tells you the annual rate of return per investment.
Is a 7% return on investment good?
Now that you have a baseline indexing approach that’s easy to follow, is it a good return on investment?
To put the numbers another way, using the Rule of 72, you’ll double your wealth in 10 years and 3 months. not bad. Much cheaper than borrowing from a bank.
The Rule of 72 is an important rule that tells you how long it takes to double your money. Putting time into perspective changes how you look at good returns. After all, time turns into years of labor…
– dividend earner
But is 7% okay? Compared to bank interest rates, the answer is yes.
How does it compare to GIC (Guaranteed Investment Certificates)? It is important to make sure that there is risk on the one hand and no risk on the other.
Here is what CIBC offers for GIC: Competition is probably a similar plus/minus variation.
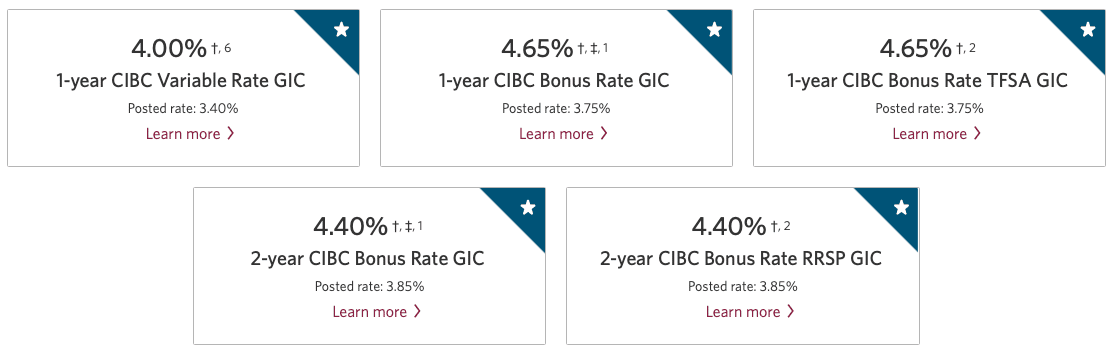
Using the Rule of 72 again, it would take just over 15 years to double your money if you invested in these GICs. The iShares XIC ETF is still ahead.An extra 2.35% makes a huge difference in how fast you can go Double your money.
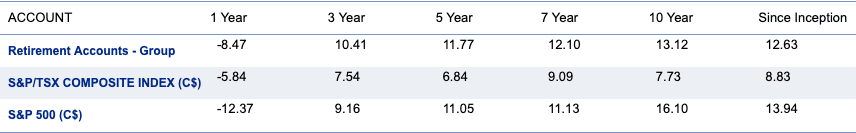
homework: Check the annual rate of return from discount brokers. See how it compares by account and overall. Below is a report from RBC on my portfolio.

Is the Stock Market Risk Worth the Payoff?
Is the stock market risk worth it now?
The first doubling takes another 5 years, and the second doubling later takes another 5 years. It takes 20 years to double for Canadian Index ETFs, not 30 for GICs. Or another 10 years of hard labor.
Conservative, risk-averse investors can be happy with 5%. Ultimately, it will determine when you can retire. 5% is fine, but 7% is generally sufficient as it also represents the average performance of the TSX.
Most investors are better off investing 7% over 30 years because they can’t beat the index.
homework: Everything doesn’t have to be complicated when you start investing. Simply select an index and start your commission-free trading platform. Take a moment and ask yourself if you can buy one index ETF and stack up to $100,000. If you’ve been investing for a while, check the rate of return and ask the right questions about your investment.
Is a 10% return on investment possible?
In Canada, we found that the stock market generally yields a 7% return. To do well in Canada, you should consider a professional investment, which carries a higher risk.
Fortunately, Canadians have easy access to the US market. Taking a similar approach to TSX, let’s take a look at the major US indices and the products that track them.
With the S&P 500 Index covering the major blue chips in the US, you can get solid results. Unfortunately, none of the ETFs tracking the S&P 500 were created before 2008.
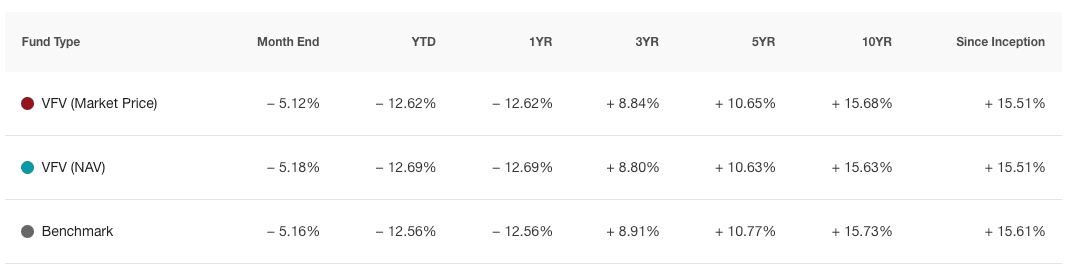
iShares’ XUS ETF has returned 14% since 2013, while the Vanguard VFV ETF has returned 15% since 2012. Adding BMO ZUE brings it back to 11% on May 9, 2009.
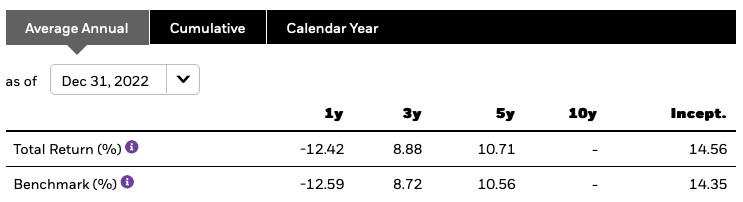
Using the Rule of 72 again at 11% of BMO ZUE, you can double your wealth in 6 years and 6 months. About four years faster than the TSX. Again, how long do you want to work before reaching your retirement number?
You can earn a 10% return by investing in one of the world’s largest economies without risking individual stocks. It is possible and very easy to achieve.
As a Canadian, why not invest in the S&P 500? It has to do with being Canadian and prejudice. You have to fight the urge to hold Canadian assets, but there are also tax implications depending on which account you invest in.
homework: Ask yourself what is stopping you from owning just one ETF. Use it as a benchmark if your holdings can’t keep up during the accumulation period.
Can dividend stocks yield 10% annual returns?
A wide range of stock market indices have been established, giving you an annual return on investment of 10%, or at least 7% to 10%. What about investing in individual dividend stocks?
The idea here is to have a buy-and-hold list of dividend stocks, as opposed to Tesla (or the next stock), which aims to invest in the sky. And we’re not even talking about retirement income stocks.
Funded Dividend Income Stocks
We need to explain what happens if we hold BCE at a yield of 5%. Many investors buy BCE for their portfolios in their thirties, relying on yield as a baseline for returns.
People often say I get at least a 5% return, does that mean a 5% return on investment is good? But yesterday the GIC didn’t offer his 5% … which is why income investors move their holdings … when interest rates rise, the nature of the risk-reward makes them move their money out of the stock into his GIC Move.
Back in the BCE, investors often ignore stock price growth because the mental model is to drop dividends and compound for growth.
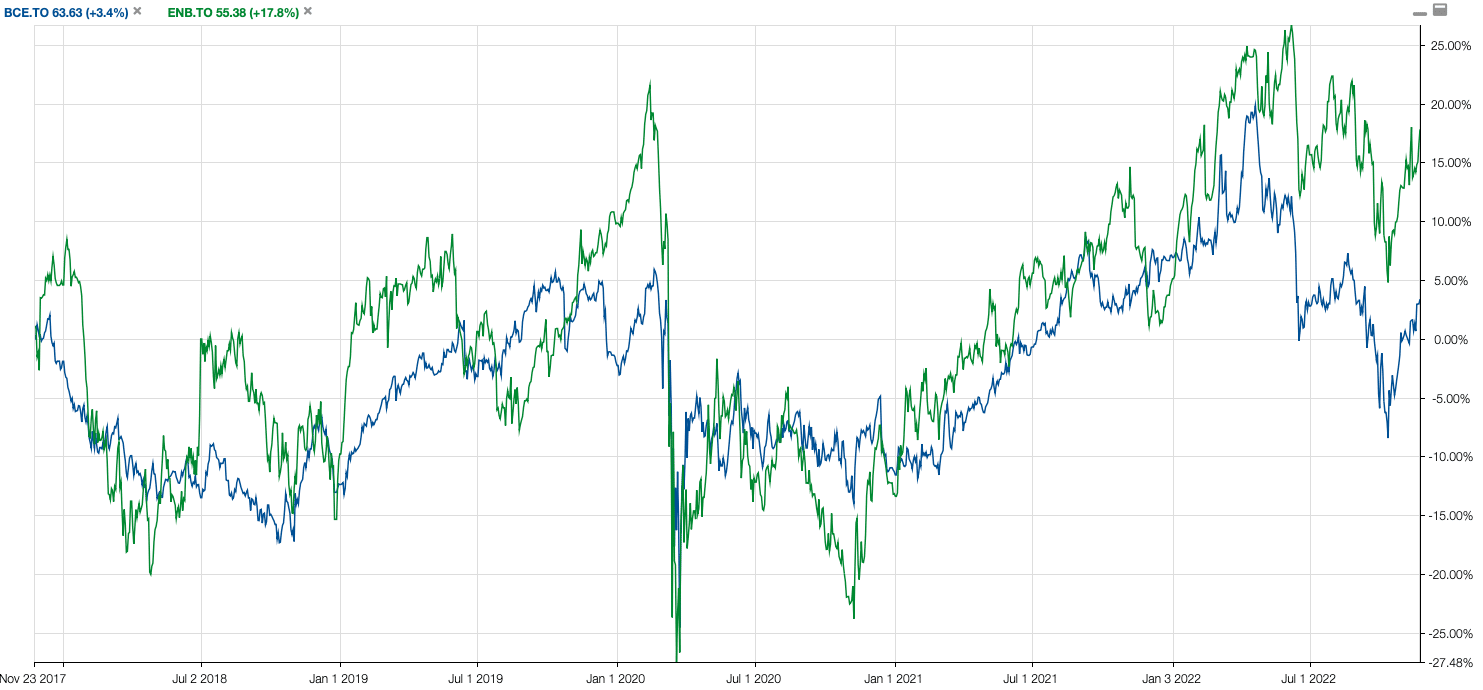
Below are two of my favorite holdings out of many yield-dependent holdings. The first graph is pure stock price, BCE shows his 3.4% growth over 5 years, while ENB shows 17% growth. Right now, 17% over five years isn’t a big deal, and 3.4% isn’t keeping up with inflation.
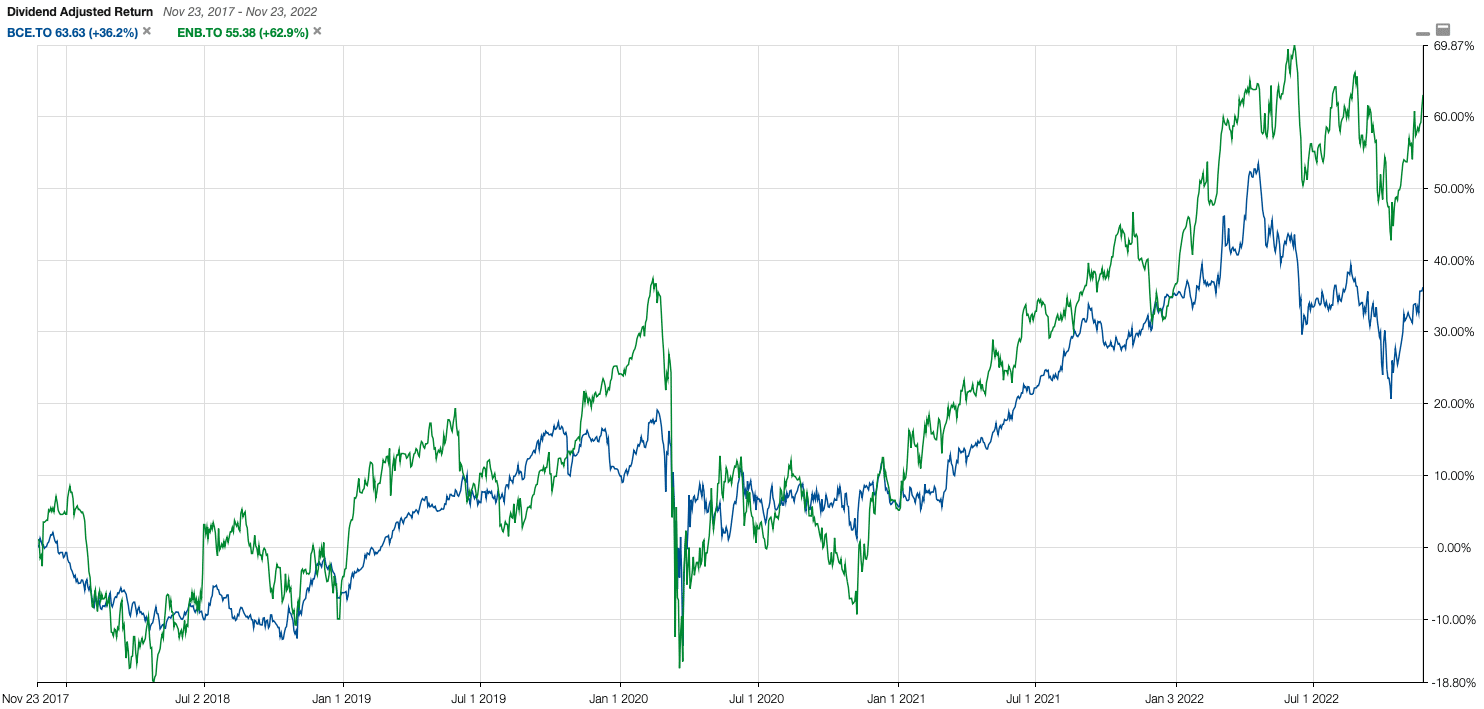
Once the dividends are reinvested, the compding works, with 36% growth in BCE and 62% growth in ENB over five years.
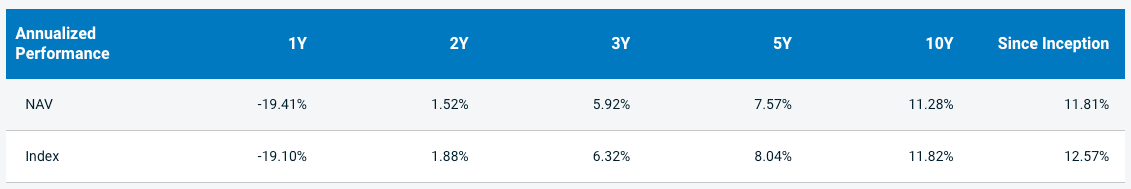
Total returns including dividends may look good for 5 years, but if you own an S&P500 ETF, it’s better than either. A table showing returns. This is slightly better than the Canadian index and takes more risk on individual holdings.
dividend growth stocks win
When it comes to portfolio growth, we see an inverse relationship between yields and annualized returns, with banks reaching a midpoint.
Higher yields usually mean less growth. This means lower valuations and higher dividend growth. Usually that means there is still growth and yields tend to be lower as more money is reinvested into the business.
As you can see, it’s very easy to find solid businesses that can deliver 10% annualized returns. A good stock screener also makes it easy to find stocks and manage risk by market capitalization.
A return of 10% per annum is possible and very easy to target. The biggest challenge investors need to achieve these results is when they deviate from their plans by trying something different. Investing in US stocks is also easy. There aren’t many Canadian stocks that are growing continuously…
Build TFSA with 10% return
It’s very easy. Deposit your maximum amount each year to buy the Vanguard VFV S&P 500 Index and you’re good to go.
Check out the table below to see how fast your portfolio grows at 10%.
| 1 | 2009 | 5,000 | 5,000 | 5,250 | 5,500 | not tracked | not started |
| 2 | 2010 | 5,000 | 10,000 | 10,762 | 11,550 | not tracked | not started |
| 3 | 2011 | 5,000 | 15,000 | 16,550 | 18,205 | not tracked | not started |
| Four | year 2012 | 5,000 | 20,000 | 22,628 | 25,525 | not tracked | not started |
| Five | 2013 | 5,500 | 25,500 | 29,534 | 34,128 | $41,742 | not started |
| 6 | 2014 | 5,500 | 31,000 | 36,786 | 43,590 | $52,820 | not started |
| 7 | 2015 | 10,000 | 41,000 | 49,125 | 58,949 | $56,307 | not started |
| 8 | 2016 | 5,500 | 46,500 | 57,356 | 70,984 | $70,200 | not started |
| 9 | 2017 | 5,500 | 52,000 | 65,999 | 84,034 | $78,900 | $13,308 |
| Ten | 2018 | 5,500 | 57,500 | 75,074 | 98,487 | $96,937 | $58,818 |
| 11 | 2019 | 6,000 | 63,500 | 85,128 | 114,986 | $129,467 | $82,596 |
| 12 | 2020 | 6,000 | 69,500 | 95,684 | 133,030 | $153,993 | $95,906 |
| 13 | 2021 | 6,000 | 75,500 | 106,769 | 152,933 | $181,601 | $113,194 |
| 14 | 2022 | 6,000 | 81,500 | 118,407 | 174,827 | $183,031 | $144,633 |
| 15 | 2023 | 6,500 | 88,000 | 131,152 | 199,459 | $177,177 YTD | $144,624 YTD |
| 16 | 2024 | 6,500 | 94,500 | 144,536 | 226,555 | ||
| 17 | 2025 | 6,500 | 101,000 | 158,587 | 256,361 | ||
| 18 | 2026 | 6,500 | 107,500 | 173,342 | 289,147 | ||
| 19 | 2027 | 7,000 | 114,500 | 189,359 | 325,762 | ||
| 20 | 2028 | 7,000 | 121,500 | 206,177 | 366,038 | ||
| twenty one | 2029 | 7,000 | 128,500 | 223,836 | 410,342 | ||
| twenty two | 2030 | 7,500 | 136,000 | 242,902 | 459,626 | ||
| twenty three | 2031 | 7,500 | 143,500 | 262,923 | 513,838 | ||
| twenty four | 2032 | 7,500 | 151,000 | 283,944 | 573,472 | ||
| twenty five | 2033 | 7,500 | 158,500 | 306,016 | 639,069 | ||
| 26 | 2034 | 7,500 | 166,000 | 329,192 | 711,226 | ||
| 27 | 2035 | 7,500 | 173,500 | 353,526 | 790,599 | ||
| 28 | 2036 | 7,500 | 181,000 | 379,078 | 877,909 | ||
| 29 | 2037 | 7,500 | 188,500 | 405,906 | 973,950 | ||
| 30 | 2038 | 7,500 | 196,000 | 434,077 | 1,079,595 |