
RSI Indicator Explained – What is RSI Indicator?
The ‘Relative Strength Index’ or ‘RSI’ indicator is a popular member of the ‘oscillator’ family of technical indicators. J. Wells Wilder created the RSI to measure the relative change that occurs between closing highs and lows. Traders use the index to determine overbought and oversold conditions, providing valuable information in setting entry and exit levels in the forex market.
The RSI is classified as an “oscillator” because the resulting curve fluctuates between values between 0 and 100. Indicators usually have lines drawn at both “30” and “70” values as warning signals. Values above ’85’ are interpreted as strong overbought conditions or ‘sell’ signals, while curves below ’15’ generate strong oversold conditions or ‘buy’ signals.
RSI formula
The RSI indicator is common in Metatrader4 trading software and the sequence of formulas includes the following simple steps:
Select a predetermined period of time “X” (standard value is “14”, but values ”8″ or “9” tend to be more sensitive.
Calculate ‘RS’ = (Average of ‘X’ periods of rising close prices/Average of ‘X’ periods of falling close prices;
RSI = 100 – [100/(1 + RS)]
The software program performs the necessary computational work to produce the RSI indicator shown at the bottom of the chart below.
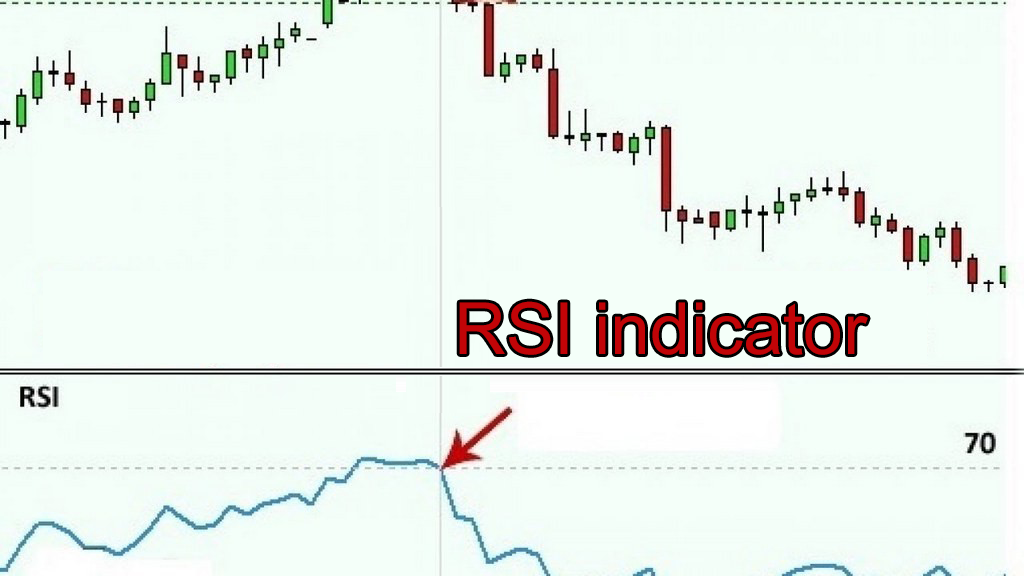
The RSI indicator consists of a single movement curve.
Large spikes in price movements can cause the RSI indicator to give false signals. Complementing the RSI with another indicator is wise. Wilder also believed that the indicator’s strength would come when its values deviated from prevailing market prices.
If you don’t like standards RSIyou can try Currency RSI scalper.
Currency RSI scalper For MetaTrader 4: https://www.mql5.com/en/market/product/62143
Currency RSI scalper For MetaTrader 5: https://www.mql5.com/en/market/product/33032